GiveWell staff growth
This page looks at GiveWell’s staff growth over the years. The data is from the Our People page, retrieved using the Wayback Machine. The page seems to have been created in mid-2010, so that’s where the table starts (and before that, the number was presumably 2–4 anyway). This is meant to be illustrative and not comprehensive. Care was taken to detect the first point in time when an employee appeared or disappeared from a page, so the above table should be generally accurate but probably not completely so (feel free to contact me about errors). The Wayback Machine also had spotty coverage that lacked several months.
At some point between mid-August and mid-September in 2016, GiveWell removed a bunch of their employees from the Our People page. My guess is that they are the ones who mainly do work on the Open Philanthropy Project. They seem to be listed separately on the Open Phil “Team” page. For this reason, I have stopped adding to the original table (the first table below) and have instead started a new table starting at September 10, 2016 (the second table below).
Tables
| Date | Num | Diff |
|---|---|---|
| 2010-06-09 | 4 | |
| 2011-06-04 | 4 | |
| 2011-09-25 | 5 | |
| 2012-01-02 | 4 | |
| 2012-02-08 | 5 | |
| 2012-07-19 | 8 | |
| 2013-01-13 | 6 | |
| 2013-04-30 | 7 | |
| 2013-08-15 | 8 | |
| 2013-09-28 | 10 | |
| 2013-12-14 | 11 | |
| 2014-07-13 | 12 | |
| 2014-11-03 | 18 | |
| 2015-02-01 | 18 | |
| 2015-05-01 | 18 | |
| 2015-06-16 | 23 | |
| 2015-08-16 | 24 | |
| 2015-10-01 | 30 | |
| 2015-10-31 | 32 | |
| 2015-11-22 | 31 | |
| 2015-12-15 | 32 | |
| 2016-03-10 | 31 | |
| 2016-06-25 | 35 | |
| 2016-07-23 | 37 | |
| 2016-08-13 | 36 |
Since September 2016 I have kept track of separate employee counts for GiveWell and Open Phil. A couple of notes:
- Kaitlyn and Mike Krieger are counted as two people even though they are listed together on one page on the Open Phil Team page.
- I have used some notation from set theory. The idea is that you can think of GW and OP below as the sets of employees of GiveWell and Open Phil, respectively. There are some employees, like Holden Karnofsky, who are in both sets. Intersecting these sets, one obtains GW ∩ OP, the set of employees of both organizations. We can also subtract the OP set from the GW set, obtaining GW ∖ OP, the set of employees of only GW. To get the employees who are in GW regardless of whether they are in OP, just add the numbers for GW ∩ OP and GW ∖ OP.
- I have merged the Diff column into the Num column (to use the terminology of the previous table) of each set.
| Date | GW ∩ OP | GW ∖ OP | OP ∖ GW |
|---|---|---|---|
| 2016-09-10 | 2 | 18 | 20 |
| 2016-10-01 | 2 | 19 | 20 |
| 2016-11-04 | 2 | 18 | 20 |
| 2016-12-05 | 2 | 18 | 20 |
| 2017-01-05 | 2 | 17 | 20 |
| 2017-02-05 | 2 | 15 | 21 |
| 2017-03-08 | 2 | 14 | 21 |
| 2017-04-20 | 2 | 16 | 21 |
| 2017-05-05 | 2 | 16 | 21 |
| 2017-06-05 | 2 | 16 | 20 |
| 2017-07-05 | 1 | 16 | 23 |
| 2017-08-05 | 1 | 16 | 24 |
| 2017-09-06 | 1 | 16 | 22 |
| 2017-10-07 | 1 | 16 | 22 |
| 2017-11-06 | 1 | 18 | 22 |
| 2017-12-05 | 1 | 19 | 22 |
| 2018-01-05 | 1 | 19 | 22 |
| 2018-02-06 | 1 | 18 | 21 |
| 2018-03-06 | 0 | 19 | 21 |
| 2018-04-06 | 0 | 19 | 22 |
| 2018-05-05 | 0 | 20 | 22 |
| 2018-06-05 | 0 | 21 | 22 |
| 2016-06-12 | 0 | 21 | 24 |
On June 12, 2017, GiveWell and Open Phil announced that Open Phil has become an independent organization. Because of this change, Holden Karnofsky has moved from GW ∩ OP to OP ∖ GW.
Sometime between August 5, 2017 and September 6, 2017, Kaitlyn and Mike Krieger were removed from the team page, which is why the count there drops by two. You can still view an archive of their profile page.
For 2017-10-07, this is the date of the GiveWell snapshot. The Open Phil snapshot is from 2017-10-08.
Note as of June 2018, I’m starting to move this data to Org Watch, a website that tracks organizations. I will probably only update the information on there from now. Org Watch currently doesn’t have the same table, but something close to it should eventually be available.
Plots
The following is a plot of the table above (which is better in some sense because it indicates the gaps when the employee count did not change):
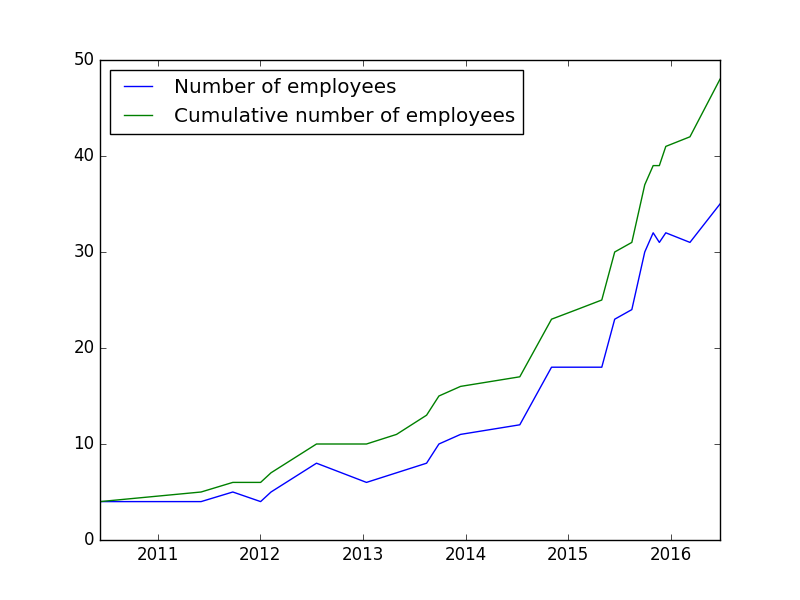
The “cumulative number of employees” is just the number of people who have at one point worked for GiveWell, as of the indicated date; it is obtained by summing up the positive number in the diff column up to the date in question, and then adding the initial employee number.
Note that the gap between the two curves cannot decrease. It is for this reason that the survival ratio is good to look at in addition to the above graph:
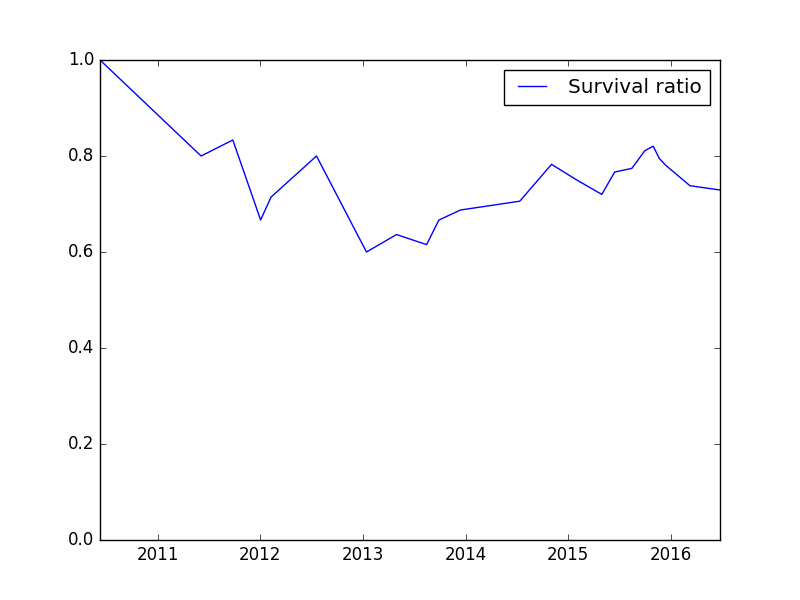
At each time , the survival ratio is ‘the number of employees at time ’ divided by ‘the number of cumulative employees at time ’.
Commentary
Note that during the June 2016 GiveWell board meeting, Elie said there are 15 full-time staff for Open Phil and 15 for GiveWell, with 8 shared operation staff. In other words, the table and plot don’t distinguish between GiveWell and Open Philanthropy Project employees (as it is difficult to do so across time). GiveWell also seems to sometimes think in terms of “Holden–Elie equivalents”, i.e. how many employees there are if they are all replaced by Holden or Elie, so the idea is that the number of GiveWell employees might have decreased in some sense since Holden and some senior employees have moved to Open Phil (this sentence might not accurately reflect what is the case, but I include it to make transparent some of the thinking I think is going on). The numbers are also of full-time staff only, so does not include interns, conversation notes writers, etc.
In addition, Attachment D (cell B7) from the June 2016 board meeting projects not more than 53 employees by June 2017.
Also from my board meeting page:
21:10: Elie: Just going through our first round of turnover, where people who we hired 3 years ago are deciding to move on. In conversations with us, doesn’t seem like good long-term fit for them. Until recently hasn’t happened at all. Surprised.
Relevant here is Milan Griffes, who worked at GiveWell from August 2014 to May 2016 and who recently published a post about his experience, where he lists “the object-level work didn’t align well with my interests” as a reason for leaving GiveWell.