Revisiting the “great decline” in Wikipedia pageviews
Summary
In March 2015 one of us (Vipul Naik) wrote “The great decline in Wikipedia pageviews” (called “the original post” in this post). This post is intended as an update to some of the points from that article, along with some graphs.
The central puzzle
The central puzzle has not changed much since the original post, but to be explicit, here are the questions we originally had and hope to answer to some extent in this post:
- Have desktop pageviews actually declined?
- What can explain the observed decline in desktop pageviews?
- Have overall pageviews declined?
- Do people subjectively feel they are using Wikipedia less? How do we square their subjective impressions with the stats?
Why is this important?
The original post discusses several motivations for looking at Wikipedia pageviews. You can read that post for more details, but to summarize, Wikipedia pageviews are useful as a way to understand:
- what people are interested in learning about
- the overall growth of the internet
We have been interested in this and one of us (Vipul) has written other articles such as “How to Understand Your Website Traffic Variation with Time” on wikiHow.
A more recent motivation for us is the following. As content creators and more recently as a funder of content creation work, one of the appeals of writing articles for Wikipedia is that they receive more pageviews than if the same articles are hosted on another site (such as a personal site). However if Wikipedia’s viewership is actually declining, this is something to consider.
Overall pageviews vs pageviews of specific pages
Overall pageviews data, i.e. the summed pageviews of all pages within each combination of language and access type (desktop, mobile), are available separately from pageviews data of specific pages. The Wikimedia Foundation publishes some of the pageview statistics for overall pageviews data in places such as:
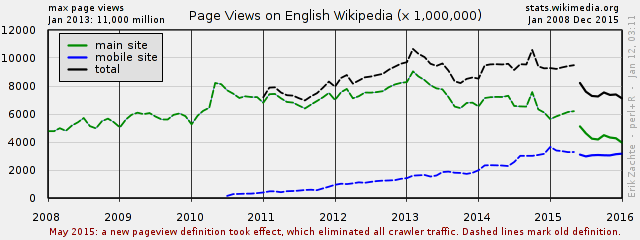
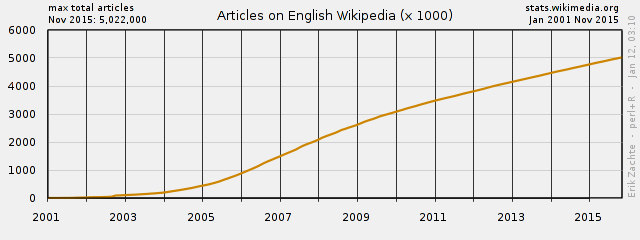
- the “Wikimedia project at a glance” page, which has a plot for the total pageviews on the English Wikipedia since 2008 (both of Erik Zachte’s plots below come from this page)
- the Vital Signs dashboard, which is more interactive but only has pageviews data starting July 1, 2015
- the Wikipedia monthly combined chart
Other statistics for various overall growth can be found on the Wikipedia Statistics page, e.g. there is a page on the size of Wikipedia.
On the other hand, pageviews data for specific pages are available in various forms:
Raw dumps are most consistently available in various datasets such as
- pagecounts-raw (December 10, 2007 – August 5, 2016), which only includes desktop pageviews and does not allow for identification of bots
- pagecounts-all-sites (September 23, 2014 – August 5, 2016), which includes desktop as well as mobile pageviews but does not allow for identification of bots
- pageviews (starting May 1, 2015), which includes desktop as well as mobile pageviews and allows for identification of bots, but only recently became available
However all of these datasets are difficult to manage due to their large file sizes.
From stats.grok.se, for desktop pageviews from December 10, 2007, through December 2015.
From the Wikimedia Pageview API starting July 1, 2015.
In other words, the situation is slightly more complicated for per-page pageviews, and there are fewer ready-made plots available for analysis. On the other hand, looking at the overall pageviews data has more interference from new pages being created. Specific pages that have been around for almost all of the period we look at, such as pages for colors or countries, don’t have this particular form of interference. Another benefit of looking at specific pages is that their full revision history is more manageable. This means that if, say, a large part of a page was siphoned off to another page and resulted in fewer pageviews for the original page, this can be detected.
What has changed since March 2015?
The original post:
Although the data is available, it’s not currently in an easily computable form, and I don’t currently have the time and energy to extract it. I’ll update this once the data on all pageviews since September 2014 is available on stats.grok.se or a similar platform.
If we want to look at the mobile pageviews data for specific pages between September 23, 2014 (when pagecounts-all-sites started) and the end of June 2015 (after which the Wikimedia Pageview API was launched), the only thing we can do is to try to process the raw dumps, which we did not do as it would have given a little more clarity but not all that much more. The per-page pageviews data from before September 23, 2014 are not available because raw server access logs are deleted after about two weeks. We are therefore working with rather limited data. Nevertheless we still think it’s worth looking at the mobile pageviews data that we do have for specific pages because:
- One thing we wanted to look at is the mobile-to-desktop pageviews ratio of various types of pages.
- There is enough data now from the Wikimedia Pageview API to make the graphs interesting to look at. (See § Shift to mobile.)
In the LessWrong version of the original post, Strilanc commented:
Could you convert the tables into graphs, please? It’s much harder to see trends in lists of numbers.
How we investigated this
Data sources:
Wikipedia Views (stats.grok.se and Wikimedia Pageview API).
Note on stats.grok.se: stats.grok.se is just a data visualizer. It uses pagecounts-raw, which:
was maintained by Domas Mituzas originally and taken over by the analytics team. It was and still is the most used dataset, though it has some [major] problems. It does not count access to the mobile site, it does not filter out spider or bot traffic, and it suffers from unknown loss due to logging infrastructure limitations.
In other words, stats.grok.se uses an older dataset and older definition of pageview that does not do any bot or spider filtering.
Google Trends (for musicians). For more on the Google Trends exports, see the section in the plotting documentation
comScore data, WMF overall numbers
Google Consumer Surveys and SurveyMonkey Audience
See also the timeline of Wikimedia analytics that was created as part of this process.
Surveys
As mentioned in the introduction, our two main investigation methods were plotting pageviews in various ways and conducting several surveys. This section gives an overview of the surveys and lists the questions for each survey for reference. Since both the plots and the surveys were used to test various hypotheses about the “great decline”, the actual discussions about the survey results are separately embedded in the various discussions about these hypotheses.
Several surveys:
- A Google Consumer Surveys survey of a US audience (without any demographic filters) asking people to compare how much their Wikipedia usage has changed since 2011. This was answered by 1036 people. You can see the results page. Note that for this survey, we had to shorten the responses from what they were originally due to Google Consumer Surveys’ response character limits.
- A SurveyMonkey US Audience survey (again, no demographic filters) asking the same question as the Google Consumer Surveys survey, plus some other background and follow-up questions. We ran this for 50 people and TODO answered. After this, we changed the order of the questions to ask about Wikipedia first, then about general internet use and use of search engines. We ran this second version for 50 people and TODO answered.
- Vipul’s timeline (first version)
- UW audience (which version?)
- More audiences?
Google Consumer Surveys survey
This survey had a single question:
- How does your use of Wikipedia, the online encyclopedia, compare to
your use 5 years ago (2011)?
- don’t use now; didn’t use in 2011
- use now; didn’t use in 2011
- don’t use now; used in 2011
- use now; used in 2011 (to similar extent)
- use now; used in 2011 (much more now)
- use now; used in 2011 (much less now)
- Other (please specify)
Since this was a Google Consumer Surveys survey, the respondent was also given the options “Show me a different question” and “Skip survey” below the question above.
The survey results are available.
SurveyMonkey first survey (internet first)
Note that there is more logic to this survey than a simple list: questions 6 and 7 were only shown if the respondent indicated that their Wikipedia use changed since 2011 in question 3; if they said more, they were shown question 6 and if they said less, they were shown question 7 (which was numbered question 6 for these people).
None of the multiple-choice options were randomized. (TODO: verify.)
A dummy/mock-up version of the survey is available.
- How does your use of the Internet compare to your use 5 years ago
(2011)?
- don’t use now; didn’t use in 2011
- use now; didn’t use in 2011
- don’t use now; used in 2011
- use now; used in 2011 (to similar extent)
- use now; used in 2011 (much more now)
- use now; used in 2011 (much less now)
- How does your use of search engines (Google search) compare to your
use 5 years ago (2011)?
- don’t use now; didn’t use in 2011
- use now; didn’t use in 2011
- don’t use now; used in 2011
- use now; used in 2011 (to similar extent)
- use now; used in 2011 (much more now)
- use now; used in 2011 (much less now)
- How does your use of Wikipedia, the online encyclopedia, compare to
your use 5 years ago (2011)?
- don’t use now; didn’t use in 2011
- use now; didn’t use in 2011
- don’t use now; used in 2011
- use now; used in 2011 (to similar extent)
- use now; used in 2011 (much more now)
- use now; used in 2011 (much less now)
- Do you have any thoughts on why this is the case for you?
- Free response
- How do you mainly access Wikipedia?
- Browser on desktop or laptop computer
- Browser on mobile device
- A specialized Wikipedia app
- You said that you use Wikipedia more now than in 2011. You also gave
suggestions as to why. Here are some other reasons we’ve thought about
that might not have occurred to you. Please select any that apply to
you.
- I didn’t even have Internet access back then
- I go to school now and I didn’t before
- I just use the Internet more
- I think Wikipedia is more reliable now than it used to be
- Wikipedia has more relevant content for me now
- I just select whatever is at the top (or near the top) of search engine results, and I guess Wikipedia is showing up more
- Other (please specify)
- You said that you use Wikipedia less now than in 2011. You also gave
suggestions as to why. Here are some other reasons we’ve thought about
that might not have occurred to you. Please select any that apply to
you.
- Google Knowledge cards
- I use tools like Apple’s Siri to access data from Wikipedia without reading it directly
- I just select whatever is at the top (or near the top) of search engine results, and I guess Wikipedia is showing up less
- I’m just generally more knowledgeable so I don’t need as much encyclopedic information
- Wikipedia seems to have less relevant content for me; I use other websites/wikis more now
- Wikipedia’s quality has decreased so it’s not as good now
- I now think Wikipedia is less reliable as a source of information
- I’m not in school anymore
- I use the Internet less in general
- Other (please specify)
SurveyMonkey second survey (Wikipedia first)
For this survey, the Wikipedia questions were asked first, and then the more general internet and search engine questions. Questions 4 and 5 were only shown when the respondent indicated that they had changed their Wikipedia use since 2011; if more, the respondent was shown question 4 and if less they were shown question 5. All respondents then proceeded to question 6.
None of the multiple-choice options were randomized. (TODO: verify.)
A dummy/mock-up version of the survey is available.
- How does your use of Wikipedia, the online encyclopedia, compare to
your use 5 years ago (2011)?
- don’t use now; didn’t use in 2011
- use now; didn’t use in 2011
- don’t use now; used in 2011
- use now; used in 2011 (to similar extent)
- use now; used in 2011 (much more now)
- use now; used in 2011 (much less now)
- Do you have any thoughts on why this is the case for you?
- Free response
- How do you mainly access Wikipedia?
- Browser on desktop or laptop computer
- Browser on mobile device
- A specialized Wikipedia app
- You said that you use Wikipedia more now than in 2011. You also gave
suggestions as to why. Here are some other reasons we’ve thought about
that might not have occurred to you. Please select any that apply to
you.
- I didn’t even have Internet access back then
- I go to school now and I didn’t before
- I just use the Internet more
- I think Wikipedia is more reliable now than it used to be
- Wikipedia has more relevant content for me now
- I just select whatever is at the top (or near the top) of search engine results, and I guess Wikipedia is showing up more
- Other (please specify)
- You said that you use Wikipedia less now than in 2011. You also gave
suggestions as to why. Here are some other reasons we’ve thought about
that might not have occurred to you. Please select any that apply to
you.
- Google Knowledge cards
- I use tools like Apple’s Siri to access data from Wikipedia without reading it directly
- I just select whatever is at the top (or near the top) of search engine results, and I guess Wikipedia is showing up less
- I’m just generally more knowledgeable so I don’t need as much encyclopedic information
- Wikipedia seems to have less relevant content for me; I use other websites/wikis more now
- Wikipedia’s quality has decreased so it’s not as good now
- I now think Wikipedia is less reliable as a source of information
- I’m not in school anymore
- I use the Internet less in general
- Other (please specify)
- How does your use of the Internet compare to your use 5 years ago
(2011)?
- don’t use now; didn’t use in 2011
- use now; didn’t use in 2011
- don’t use now; used in 2011
- use now; used in 2011 (to similar extent)
- use now; used in 2011 (much more now)
- use now; used in 2011 (much less now)
- How does your use of search engines (Google search) compare to your
use 5 years ago (2011)?
- don’t use now; didn’t use in 2011
- use now; didn’t use in 2011
- don’t use now; used in 2011
- use now; used in 2011 (to similar extent)
- use now; used in 2011 (much more now)
- use now; used in 2011 (much less now)
Two leading hypotheses: shift to mobile and non-human traffic
The two biggest ones quantitatively (device switching and bots) are covered in the graphs, and the others turned out to not be so significant or just directionally opposite, as we will see later. the others not directly covered will turn out to be less relevant
Explanation of the plots used in this section
We plotted the pageviews from December 2007 to August 2016 by varying each of the following parameters. All of the plots are listed in a directory. In addition, all of the code used to generate the plots are in a GitHub repository.
Pick one option from each of the following bullet points to arrive at a single plot.
- Tag-language combination; 16 in all. This is the beginning of the filename. Note that we inherit the term “tag” from Wikipedia Views. All the tag names can be seen on the “Multiple tags and months” page. To see the Wikipedia pages that comprise the tag, click on the tag name, then click “Submit” to submit a sample query. In the resulting page, there is a table with a column called “Tag name”; click the linked tag name to obtain a table with more columns – one for each Wikipedia page in the tag.
- Access method and agent: desktop, mobile, desktop + mobile (called “total”), desktop + mobile + spiders (called “total_spider”); 4 in all. This comes after the tag-language combination in the filename.
- All the pages in the tag or just the top 10 and total trend; 2 in all. Note that if a tag contains at most 10 pages, the top 10 plot and the plot with all the pages will be identical. This comes after the access method and agent combination in the filename, and is indicated by “top” is it is a top 10 plot and is empty otherwise.
- Rolling mean (moving average) with window size months, for , where means just the normalized pageview plot; 4 in all. This is the last part of the filename besides the extension. The rolling mean is intended to smooth out noise, but also makes transitions harder to detect. For each month, the rolling mean is calculated as follows: the pageviews of months, starting with the current month and going backwards in time, are added together and then divided by the number of days during this period. One consequence of this is that even when , the pageviews shown are not the raw pageviews for that month, but rather are normalized using the number of days in that month. It is the of this value that is then taken and plotted.
There are 16 × 4 × 2 × 4 = 512 plots in all.
For example, the file americanpundits_total_top_3.png
would be the pageviews for the “American television and radio pundits”
tag, for desktop + mobile (no spiders), with a rolling mean of window
size months, and only the top
10 pages in the tag.
To visualize the “decline” in pageviews we plotted the pageviews from Wikipedia Views, which now includes mobile data since July 2015.
In all of the plots, the vertical lines mean the following things:
- Blue: July 2015, when mobile pageviews were introduced. This is only shown in plots with mobile data.
- Green: months after July 2015, where is the window size of the rolling mean. In other words, this marks the end of the transition of including mobile data; after this line all the months used to calculate the rolling mean have mobile pageviews in them.
- Red: January 2016, when the pageviews data switches from stats.grok.se to the Wikimedia Pageview API.
- Yellow: months after January 2016, where is the window size of the rolling mean. In other words, this marks the end of the transition of switching to the Wikimedia Pageview API; after this line all the months used to calculate the rolling mean use only the Wikimedia Pageview API data.
In addition, the horizontal blue line marks the top quartile for the totals plot, i.e. the line above which the top fourth of the data lie.
The trend lines colors for the colors tag do not match the colors they represent.
Example:

Another example:

Note that a drop from ~4.3 to ~3.9 on a scale corresponds to a drop from to in terms of actual pageviews, i.e. a 60% drop.
The plots generally show that desktop pageviews according to stats.grok.se fell from around 2011 or 2013 (depending on the class of pages examined) to 2015. Adding on the Wikimedia Pageview API data for desktop from January 2016 to the present shows that this trend seems to continue, but we think the Pageview API imposes a stricter filter on bots/spiders.
Shift to mobile
On the other hand, if we add in the mobile data, we see that predictably there is a “bump” starting in July 2015, when the mobile data started; this bump is more gradual the longer the window size of the rolling mean is. However, for some classes of pages, even adding in the mobile data – while causing the desktop “decline” to become mostly flat – did not cause the pageviews to increase back to the level of 2011–2013 pageviews.
The expected bump is
where d, m are the desktop and mobile pageviews, respectively.
| Tag | % views mobile | Expected bump |
|---|---|---|
| Programming languages | 12 | 0.06 |
| Compiler theory | 29 | 0.15 |
| Philanthropic foundations | 34 | 0.18 |
| French colors | 40 | 0.22 |
| German colors | 42 | 0.24 |
| Cities | 45 | 0.26 |
| Countries | 45 | 0.26 |
| Colors | 46 | 0.27 |
| Spanish colors | 49 | 0.29 |
| Shooting-related | 50 | 0.30 |
| US presidents | 52 | 0.32 |
| American pundits | 53 | 0.33 |
| US politicians | 56 | 0.36 |
| Eggplant dishes | 57 | 0.37 |
| Musicians | 58 | 0.38 |
| Sex organs | 69 | 0.51 |
Non-human traffic
Vipul: bots usually account for < 20% of traffic and almost always for < 40% of traffic.
We also plotted the same plot with the addition of spiders. This “addition” only makes sense for the mobile pageviews and the 2016 pageviews for desktop because the pageviews from stats.grok.se already include bot pageviews (see the “How we investigated this” section for more details). Note that the Wikimedia Pageview API makes the distinction between “bot” and “spider”, but we couldn’t find pages for which the “bot” traffic was nonzero, so we simply excluded the pageviews identified as “bot”; as far as we know, “spider” means “not human”. We ended up including these spider pageviews from January 2016 for both desktop and mobile spiders, although it would have also made sense to include the mobile spiders starting in July 2015.
Here is a classification of the tags we looked at based on whether there was a rebound to 75th percentile or higher July 2015 or later:
| Tag | Rebound? |
|---|---|
| American pundits | Yes |
| Cities | Yes |
| Colors | No |
| Compiler theory | Yes |
| Countries | Yes |
| Eggplant dishes | Yes |
| French colors | No |
| German colors | No |
| Musicians | Yes |
| Philanthropic foundations | Yes |
| Programming languages | Yes |
| Sex organs | No |
| Shooting-related | Yes |
| Spanish colors | Yes |
| US politicians | Yes |
| US presidents | Yes |
As can be seen, the colors (in languages besides Spanish) and the sex organs tag did not have a rebound. However, this doesn’t mean the other tags had increasing traffic; many simply kept up with the 2011–2013 values. We think the table above gives a way to tell the tags for which the pageviews have definitely gone down since the 2011–2013 period.
Note also that because the mobile views start in July 2015, adding in the mobile views gives extra preference to the recent period after this point. This is because the mobile views from June 30, 2009 (when the mobile site was launched) until end of June 2015 are not included. In other words, had these earlier mobile views been included, the total pageviews in 2011–2013 could have been much higher. However, we suspect this wouldn’t have made a big difference because we think that mobile use of the web and of Wikipedia has on the whole gone up a lot, so that it was relatively negligible back in 2011. For instance, see the mobile site total pageviews: for the English Wikipedia, the mobile site averaged 586 million pageviews per month in 2011, 1,737 million pageviews per month in 2013, and 3,242 million pageviews per month in 2015, though note that a new pageview definition is used starting May 2015.
Below are two plots to illustrate what a rebound looks like.


Other hypotheses
- Are pageviews even declining? It seems that desktop pageviews are declining, but is this still the case if we add in mobile views? Another difficulty here is that stats.grok.se seems to have used a different exclusion method for bots/spiders (evidenced by the stats.grok.se pageviews not matching up with the pageviews from the Wikimedia Pageview API even on months where they both have data), so it’s not totally clear if even desktop is declining.
In this section we explore the possible reasons for the observed decline in desktop pageviews. Note that the decline is tag-dependent, and we expect some (but not all) of the reasons to be tag-dependent as well.
- Shift to mobile → Check by adding the mobile views and by asking people on SurveyMonkey
- People somehow preferring Wikipedia less? → Ask people.
- Is Wikipedia’s popularity in general decreasing? → Can we see that in the graph? Apparently not well.
Other plots:
- Mobile:desktop ratio vs 95% quantile
We also found the peaks for desktop and peaks overall using different windows.
Language substitution
- Language substitution → Check the same tag using different languages (we did colors in English, French, and German)
Indirect access
- Google Knowledge cards? → Ask people about this in SM survey
- Siri? → Ask people
- Could browsers like Opera Mini be adding pageviews as bots? See the “analytics and proxy/remote browsers” thread on the Analytics mailing list. Probably not.
Search engine rankings
- Wikipedia showing up less in SERPs? → Try to get access to historical SERPs for some search queries. This actually seems harder to obtain than we first thought.
Redirects
Could a change in redirects have anything to do with this? For instance see “Consider the Redirect”:
Because viewers don’t see redirects, viewing a redirect is substantively different from viewing a normal page. For example, if a user visits the article on “Seattle, Washington”, this will be recorded as a view to the redirect even though the target article “Seattle” is displayed. In this sense, views of redirects will tend to be overcounted while views of target articles will tend to be undercounted.
[…]
Because redirects are edited infrequently but “viewed” as often as millions of times per month each, redirects may be contributing to the surprisingly low correlation between edits and views noted by Priedhorsky et al. and others.
See also “Analytics/Data/Redirects – Wikitech”
Could people somehow be viewing redirects more than the actual pages,
compared to 2011–2013? To give one recent example (too recent to
matter), the Wikipedia article “New York” is about
the state, not the city. However there is a recent
shift to change all wikilinks [[New York]] to go
through the redirect page “New
York (state)”, with the wikilink
[[New York (state)|New York]]. This means that less
pageviews will be recorded for the New York page, and more will be
recorded for the redirect page. One idea is that if a sufficiently large
number of highly popular pages have similar sorts of redirection
manipulation, the pageviews for the article itself could be going down
even while people are reading the page more – the pageview is just being
distributed more between the main article and its redirect pages.
However our impression is that most pageviews come from search engine results pages, and that wikilinks are not used very much. See for instance the pageviews on redirects to Red and Black (though one complication here is that redirects might not be static, though in this case we wouldn’t expect the redirects to be changing much). Likewise there are some effects that should push pageviews less toward redirects. For instance, presumably Google and other search engines have gotten better at showing the link to the main article rather than a link to the redirect page.
Simple English Wikipedia
Could views be going to the Simple English Wikipedia? This does not seem to be the case, at least for colors; see the tabulation on Wikipedia Views.
Changes in pageview definition
See also pageview definition changes. We don’t think this is a big cause of pageview change. It’s also not clear whether pageview definitions are applied retroactively.
Further lines of exploration
This section lists various ideas for other explorations we did a bit of, or considered doing but ran out of time for.
- Comparison of Wikipedia pageviews for annual events close to the day of those events, and how those numbers have changed over the years (e.g., traffic to the Black Friday page on Black Friday, etc.)
- Comparison of traffic to the Wikipedia page of a news event relative to other objective measures of how “big” it became, to get a sense of the importance of Wikipedia in covering breaking news events
- Weekday/weekend traffic variation on Wikipedia – has Wikipedia weekday traffic changed over time differently than Wikipedia weekend traffic? Actually {weekday, weekend} × {desktop, mobile} × {now, earlier} so 2 × 2 × 2 = 8 combinations
- Correlating changes to page size, quality, and editorial activity on pages to traffic to that page
Acknowledgements
Thanks from Issa Rice to Vipul Naik for sponsoring Issa’s work on this post.
License
Most permissive license Vipul Naik allows.